Mobility Tracing Plotter
From ResiliNetsWiki
Contents |
Introduction
This plotter generates a 2D plot of the all the nodes in the file. It detects the number of the nodes from the tracing file. However, the size of the plot could be specified using user parameters in the header section of the script.
Installation
This plotter requires Python and Gnuplot installed in Unix supported OS. The script file is located in the SVN at
https://subversion.ittc.ku.edu/svn/resilinets/ns3_simulations/generic_scripts/mplotter.py
Usage
Using CLI, run this command:
python mplotter.py [inputfile] [outputfile]
Arguments
- inputfile is required
- outputfile is optional
By default, the script generates a 800 x 800 png file. This could be modified by the user using user parameters in the header section of the script.
Examples
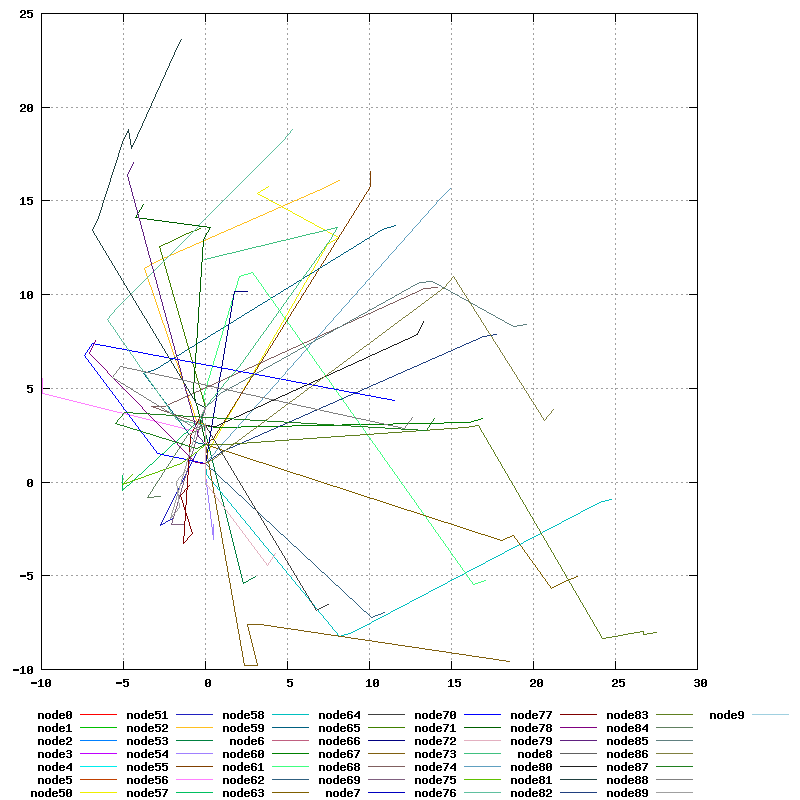
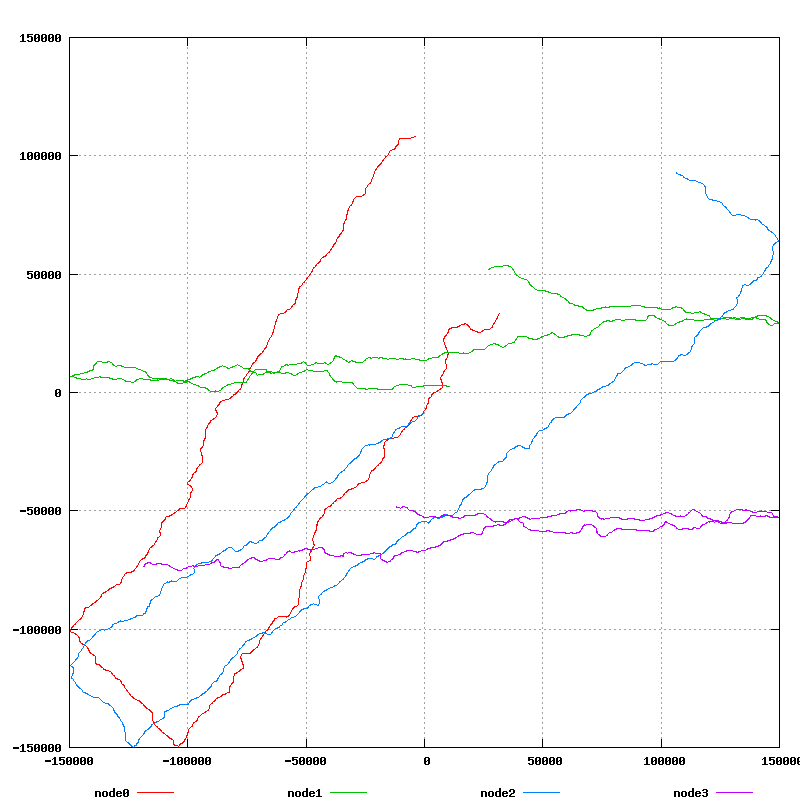
Here are two examples generated using the Mobility Tracing Plotter:
- An example with four nodes:
- An example with many nodes: