Metrics and Modelling
Contents |
Introduction
Society increasingly relies on computer networks as essential for individuals, businesses, and governments. Essential services are provided by distributed networked systems in the sectors of energy, finance, banking, education, health care, defense, transport, and communication. The consequences of disruption to either legacy or emerging networks are thus increasingly severe, and threaten the lives of individuals, the financial health of business and other organizations, as well as the economic stability and security of nations and the world. These disruptions could occur due to a number of different challenges including environmental (e.g. connectivity and delay issues), malicious (attacks against hardware, software), non-malicious (accidents, operational errors), large scale disasters (hurricanes, power failures), and lower level service failures.
In order to study the impact of the above mentioned challenges on various systems, several disciplines have evolved over time. These include fault tolerance, survivability, disruption tolerance, and traffic tolerance. In order to differentiate networks and services in terms of their ability to meet the objectives of the above mentioned disciplines, there is a need for some sort of goodness measure. There have been several such measures proposed in the literature and many of these are often applied in industry as well. Depending upon the context of service being offered, these measures characterize and quantify different aspects of a system. Some of the well-known measures include reliability, availability, dependability, and performability. We use the term Resilience to include all these measures and define it as the ability of the network to provide and maintain an acceptable level of service in the face of various faults and challenges to normal operation.
Problem Statement
Researchers agree that due to lack of consistency in evaluating network resilience, it is difficult to guarantee that the networks being designed and developed would satisfy the requirements of both the end users and their applications. Without standard metrics to measure the relative effectiveness of resilience mechanisms, it is difficult to identify potential solutions that lead to resilient networks. While it is clear that a number of new and innovative solutions are needed to provide network resilience, a key problem is how to measure and specify resilience. We need a methodology to measure the resilience (or lack thereof) of current and proposed networks and evaluate the benefit of architectures, designs, and mechanisms. This methodology needs to be both rigorous in capturing service parameters and operational metrics, as well as tractable so that it is useful in practice. The challenge is to bring order to a fundamentally complex problem; we do not underestimate the difficulty in this task and note that the QoS (quality of service) community has struggled with a related problem for some years. The development of resilience measures is further complicated by the heterogeneity of communication networks. In other words, a resilience scheme that applies well to a specific network scenario may not work as well on a different network scenario. Secondly, the resilience strategy must be multilevel because it is necessary to improve the resilience of a communication network at each layer in the protocol stack. Hence the proposed resilience evaluation methodology must support the multilevel approach. The goal of this dissertation is to develop such a framework and utilize it to develop and evaluate new resilience mechanisms for challenged networks, especially at the topology and routing sub-layers.
Thesis Statement
A multilevel two-dimensional state-space framework can be used to quantify the resilience of networked systems, and be the basis of understanding the resilience of current networks as well as evaluating the ability of new mechanisms to improve future network resilience, survivability, and disruption tolerance.
Proposed Solution
We propose a new approach to measure and quantify the resilience of the network against various challenges and attacks using functional metrics. For simplicity, assume that we are interested in evaluating the resilience of the overall network. In other words, we are considering the resilience at the application layer interface to the network.
Our approach is a three step process. First, we represent the operational condition of the network using metrics derived from the fundamental characteristics of the network. These are termed as operational metrics since they define the operational state of network parameters such as link utilization. Secondly, the level of service being provided by the network is quantified using representative functions based on application requirements such as goodput and delay; these are termed as "service parameters}. Probability distributions are used to represent metrics in cases where a single mean value does not adequately capture the dynamics and distribution of a particular metric.
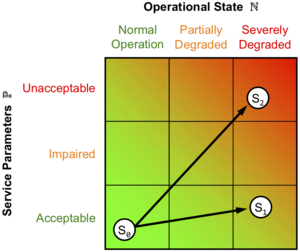
Hence, the network can be viewed (at any layer) as consisting of two orthogonal dimensions as shown in Figure 1: one is the operational state of the network, which consists of its physical infrastructure and their protocols; the second dimension is the service being provided by the network and its requirements. The full representation of the network state, thus requires a knowledge of both the operational metrics and service parameters at any given instant of time. Therefore, the third step involves aggregating operational metrics and their corresponding service parameters into discrete states which we call network staterepresented by the circles in Figure 1. Due to the time-varying nature of these metrics, especially in dynamic networks, a continuous representation gets increasingly complex with the number of such metrics. Hence, we choose a discrete representation that scales well with the number of metrics and service parameters.
In order to quantify the resilience of the system, we formulate that challenges in the form of adverse events transform the network from one state to another based on the severity of the event. Hence, network resilience can be evaluated in terms of the various network states that can be supported with a given network infrastructure (e.g. technology and topology) and their transitions under the presence of challenges. Evaluating network resilience in this way effectively quantifies it as a measure of service degradation in the presence of challenges (perturbations) to the operational state of the network. Therefore, a comprehensive view of resilience requires the knowledge of quantitative performance of the network in all the states that it may visit under normal or adverse conditions.
In order to provide a second level of granularity, the operational and service space of the network may be divided into three regions each as shown in Figure 1. This purpose of this set of coarse grained regions in which the states reside is to simplify the resilience analysis. The network operational space is divided into normal, partially degraded, and severely degraded regions. Similarly, the service space is divided into acceptable, impaired, and unacceptable regions. While an arbitrary number of such regions is possible, one of the primary goals of this work is to achieve tractable yet useful solutions, and this set of nine (3X3) regions provides the necessary abstraction while limiting the number total regions. Each region may contain multiple states if the service demands such a fine granularity. In the limiting case, each region represents just one state.
When an adverse event degrades the operational state of the network, the level of service being provided degrades as well resulting in state transitions. For example, Figure 1 shows the sample trajectory S_0 ---> S_1 that an arbitrary application may take through the network if a malicious attack were to occur. The resilience is then evaluated as the transition of the network through this state space. In the simplest case, resilience is the area under the curve obtained by plotting operational metrics versus service parameters on a multivariate piecewise axis. For example, when comparing two services over a given network, the service with a smaller slope (S_0 ---> S_1) is considered more resilient than one with a steeper slope as (S_0 ---> S_2) shown in Figure 1.
Lastly, we utilize the proposed framework to devise a resilience strategy for defensive networks as well as for resilient topology and routing in case studies involving millimeter-wave networks and highly-dynamic airborne MANETs.
Resilience of level-1 ISP topologies
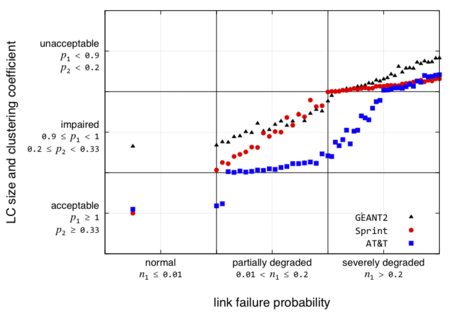
Several measures have been proposed in the literature to evaluate the ability of the network to survive link and node failures as well as various attacks. In this section, we apply the proposed resilience to wired network topologies. We conduct this study at the B_3t,3r boundary between the topology sub-level (3t) and the path routing sub-level (3r). In this case, a set of vertices V and edges E and link failures f characterize the operational state of the network. The service across this boundary is topological connectivity. For the purpose of this study we selected three service provider backbone network topologies, Sprint (US), AT&T (US), and GEANT2. Since we consider only link failures, we chose a single operational metric to represent the number of link failures. In order to characterize this service, we choose two service parameters as the relative size of the largest connected component and the clustering coefficient. We conducted simulations in MATLAB to evaluate the impact of link failures on the service parameters at this boundary. We explore the operational metric (link failure probability) over the range of [0, 0.5] in intervals of 0.01. The simulations results are averaged over 100 runs.
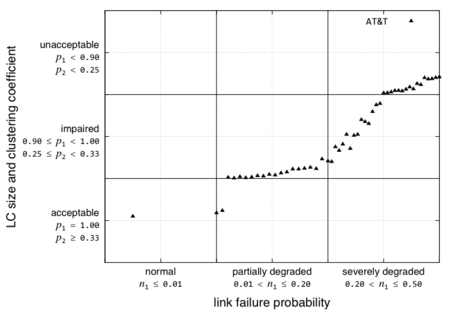
The regions for operational metrics (link failure probability) and service parameters are along with the resilience curves for the three topologies are shown in Figure 2 on a piece-wise linear axis. Note that these region boundaries are arbitrarily chosen boundaries for the purpose of analysis. However, the bounds are kept reasonable in a general sense. Depending upon the scenario, the framework can be used with a different set of bounds to evaluate resilience in that particular context. Figure 2 shows the steady state resilience of the AT&T network to link failures as degradation in the service from acceptable to unacceptable region. The region boundaries in both the operational and service dimensions are arbitrarily chosen. The purpose of this example is to show how the proposed metrics framework can be applied at a service boundary given a certain set of service constraints expressed in terms of what is acceptable, impaired, and unacceptable.
We see that the network lies in the acceptable service region under normal operating conditions. Given the rich connectivity of the AT&T network, the service remains acceptable even when the network starts degrading. However, as the failures continue the network eventually moves to impaired service. As the network operational conditions are severely degraded the service transitions from impaired to unacceptable regions. In this example, the Sprint network provides unacceptable service in the presence of a single link failure. In order to get an aggregate measure of resilience, we calculate the area under the curve formed by linear interpolation between the states. The smaller the area, the better is the resilience; in the limiting case, if the network remains acceptable for all operational conditions, the area under the curve will be zero. This would represent perfect resilience. In order to get a normalized value of resilience, we define resilience R = 1- normalized area, where normalized area is the total area divided by the span of the x-axis. For the plot shown in Figure 2, R is calculated to be 0.6338. This area represents an aggregate measure of the resilience at this boundary. While this method provides a single value for resilience, it should be noted that to gain a complete understanding of the resilience, it is necessary to inspect the state-space plot as shown in Figure 2.
Figure 3 compares the AT&T, Sprint, and GEANT2 topologies. In this case, we observe that AT&T has better resilience compared to Sprint and GEANT2 topology. The resilience R for AT&T is 0.6338 and that for sprint is 0.5410 and for GEANT2 is 0.4721. We observe that due to fewer number of links, the GEANT2 topology has very low clustering coefficient and the topology service performs poorly even in the normal operational regions.
Metrics In Progress
For details on the ongoing work and future plans please visit this page.
Ideas, comments, suggestions and crticism are welcome here
People
James P.G. Sterbenz* (advisor and chair)
David Andrews*
Tyrone Duncan*
Victor S. Frost*
David Hutchison†
Caterina Scoglio¶
Alex Wyglinski1
*The University of Kansas – †Lancaster University – ¶Kansas State University – 1Worcester Polytechnic Institute